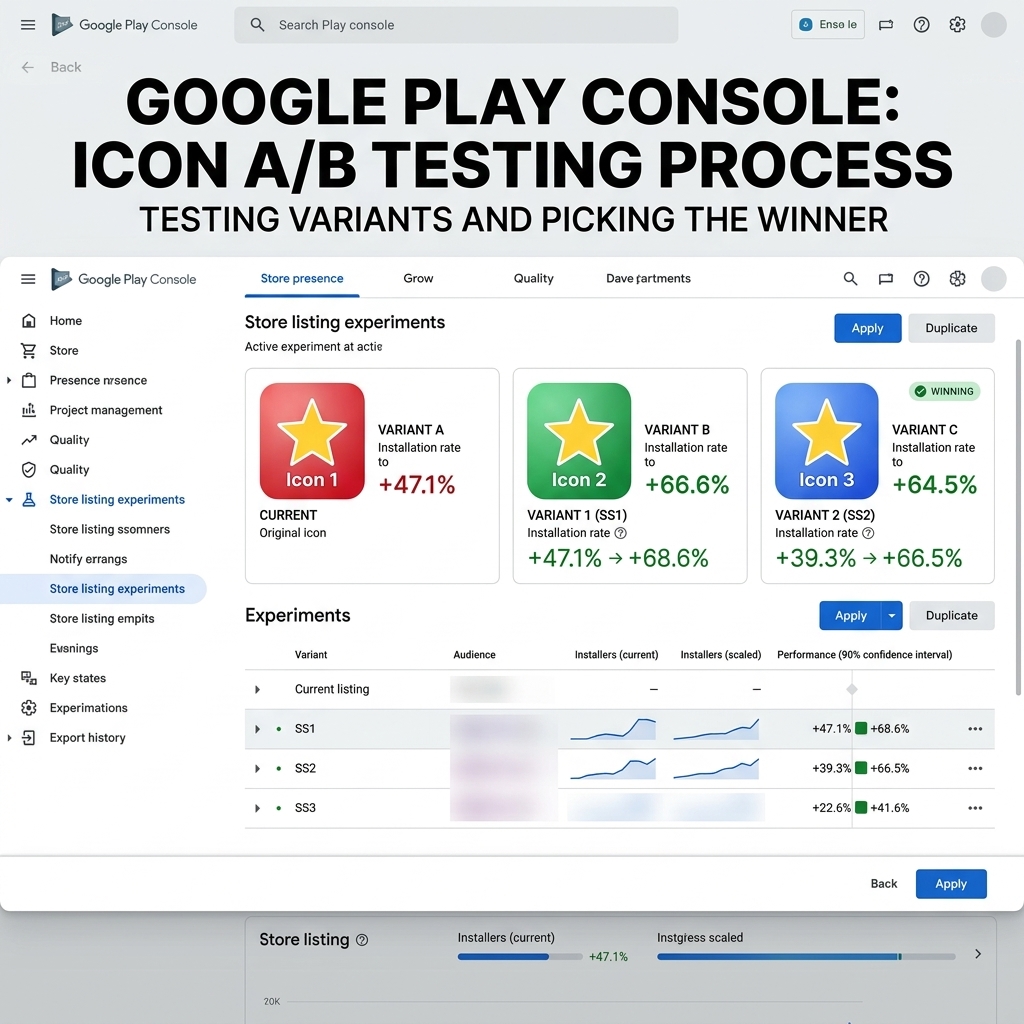
Your app icon and first screenshots decide whether a visitor installs your app or scrolls past it. But which icon actually converts better? You don’t have to guess. Google Play gives you a free, built-in A/B testing tool called Store Listing Experiments.
In this guide I’ll walk you through every single screen in Google Play Console — from opening your store listing to reading the final result — using a real icon experiment as the example. You’ll also get two free calculators: one to plan your test duration, and one to decide whether to apply the winning variant.
📋 What you’ll learn
- Before you start: what to test and what you need
- Download free sample icons for practice
- Step 1: Open your store listing
- Step 2: Set up a new experiment
- Step 3: Name, experiment type and target metric
- Step 4: Number of variants and audience %
- Step 5: Minimum detectable effect and confidence level
- Calculator: how long will my test take?
- Step 6: Choose the asset type
- Step 7: Name your variants
- Step 8: Upload your icon variants
- Step 9: Review details and AI asset declaration
- Step 10: Review assets and send for review
- How to read the results
- Calculator: should I apply the variant?
- Pro tips for winning icon experiments
- Best practices
- Common mistakes
- FAQ
Before you start: what to test and what you need
Google Play lets you test these store listing assets:
| Asset | Why test it | Impact |
|---|---|---|
| 🎨 App icon | Seen in search results, charts and on the listing — the first thing users notice | Very high |
| 🖼️ Screenshots | Explain your value before users read a single word | Very high |
| 🎬 Video | Can lift conversion for games and visual apps — or distract | High |
| 🏞️ Feature graphic | Shown at the top of the listing on some surfaces | Medium |
| ✍️ Short & full description | Only in localized experiments — test messaging per language | Medium |
Your pre-flight checklist:
- A published app with a live store listing and Admin or Manage store presence permission in Play Console.
- One clear hypothesis, e.g. “A brighter background will stand out more in search results and increase installs.”
- Your test assets ready in the right format. For icons: 512 × 512 px, 32-bit PNG, up to 1 MB, full square (Google Play applies the rounded mask itself).
- Enough store traffic — use the duration calculator below before you start.
Download free sample icons for practice
Want to practice before testing your real icon? Download these three sample icons. Each comes in 1024 × 1024 (master file) and 512 × 512 (ready to upload to Play Console).


Step 1: Open your store listing
In Google Play Console, select your app. In the left menu go to Grow users → Store presence → Store listings. You’ll see your Default store listing with its visitors, conversion rate and a link to past experiments. Click the → arrow on the right of the Default store listing row.
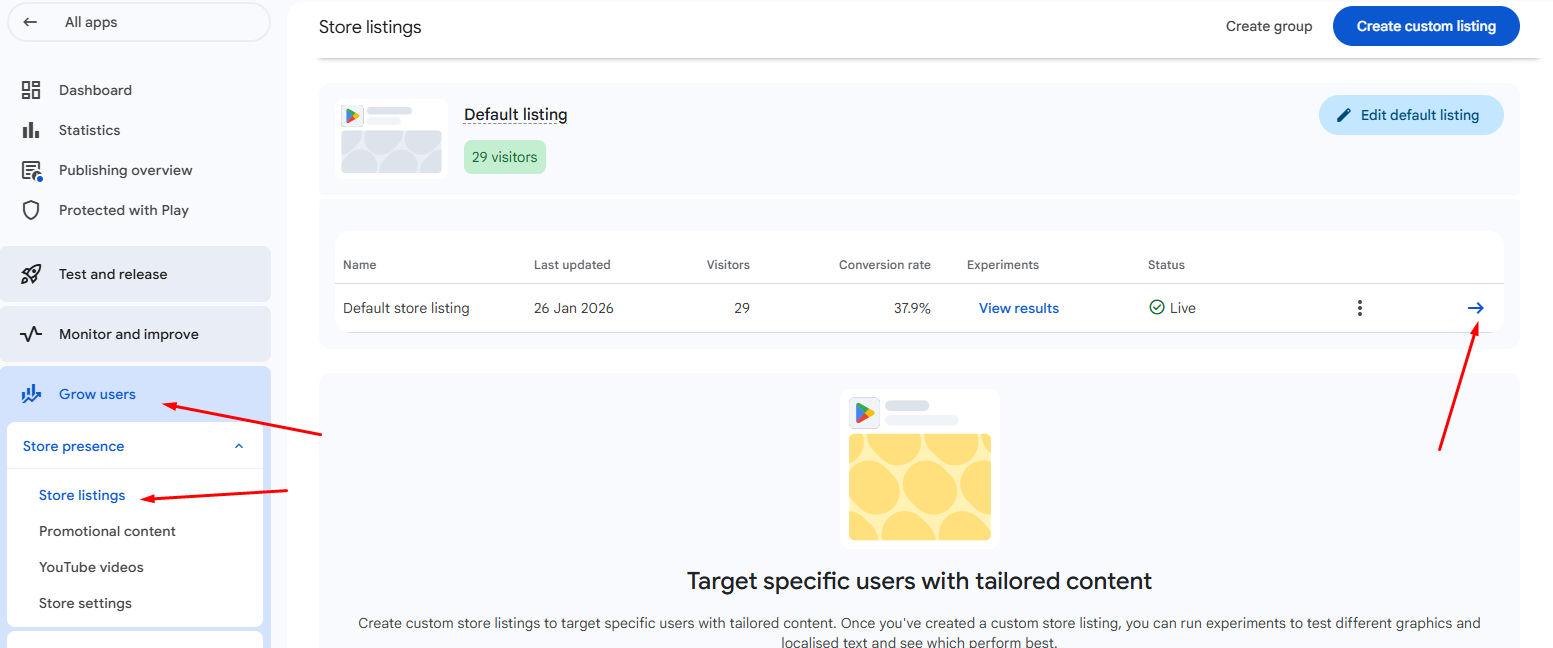
| Column | What it means |
|---|---|
| Visitors | How many people viewed this store listing in the selected period |
| Conversion rate | The share of those visitors who installed the app |
| Experiments | “View results” opens your past and running experiments for this listing |
| Status | “Live” means this listing is currently shown on Google Play |
Step 2: Set up a new experiment
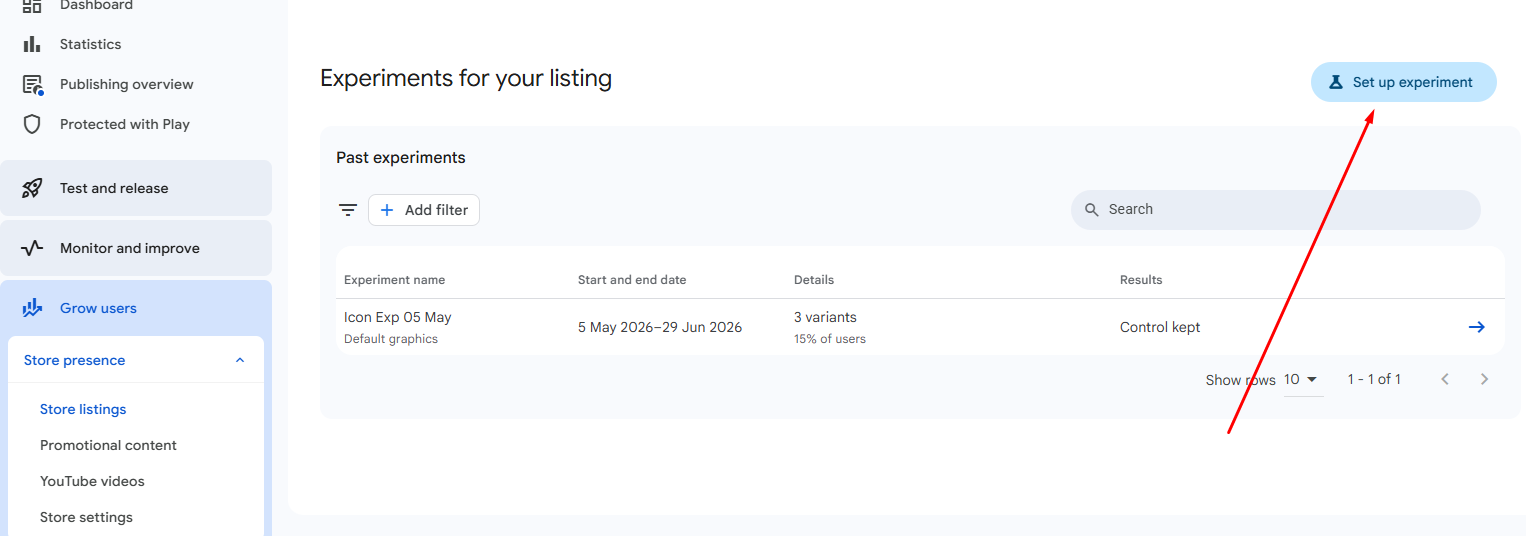
You’re now on Experiments for your listing. Here you can see your Past experiments — their name, dates, how many variants they had, what share of users saw them, and the final result. To start a new test, click Set up experiment in the top right.
Step 3: Name, experiment type and target metric
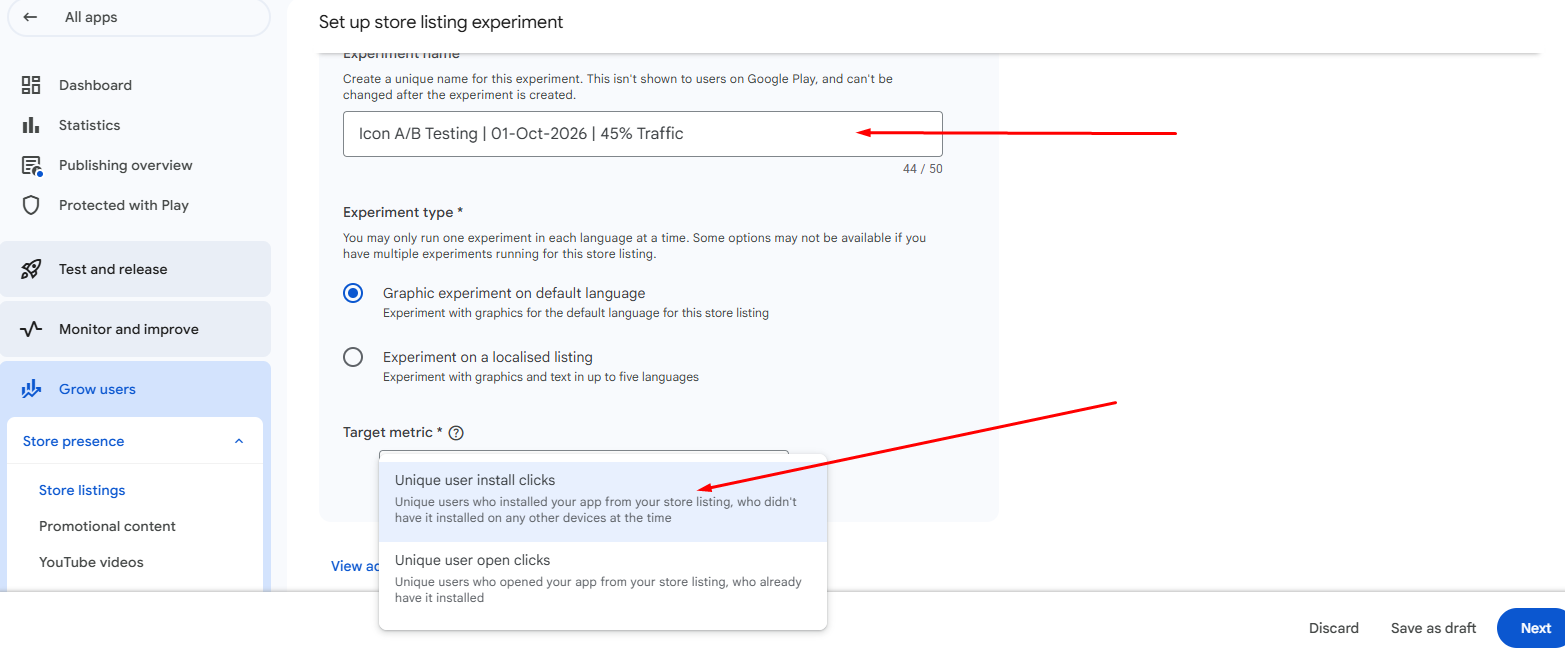
3a. Experiment name
The name is only visible to you, not to users — but it can’t be changed after the experiment is created (50 characters max). Use a naming convention so you can read your test history at a glance:
[Asset] A/B Testing | [Start date] | [Audience %]
Example: Icon A/B Testing | 01-Oct-2026 | 45% Traffic
3b. Experiment type
| Type | What you can test | Use it when… |
|---|---|---|
| Graphic experiment on default language | Graphics only (icon, feature graphic, screenshots, video) for your default language | You want to test a visual change for all users of your default listing |
| Experiment on a localised listing | Graphics and text, in up to five languages | You want to test messaging or visuals for specific markets |
You can only run one experiment per language at a time.
3c. Target metric
| Metric | What it counts | Best for |
|---|---|---|
| Unique user install clicks | Users who installed your app from the listing and didn’t already have it on another device | Most tests — you want new installs |
| Unique user open clicks | Users who already had the app installed and opened it from the listing | Re-engagement of existing users |
| Unique user pre-registration clicks | Users who pre-registered (only for pre-registration apps) | Apps not launched yet |
Step 4: Number of variants and audience percentage
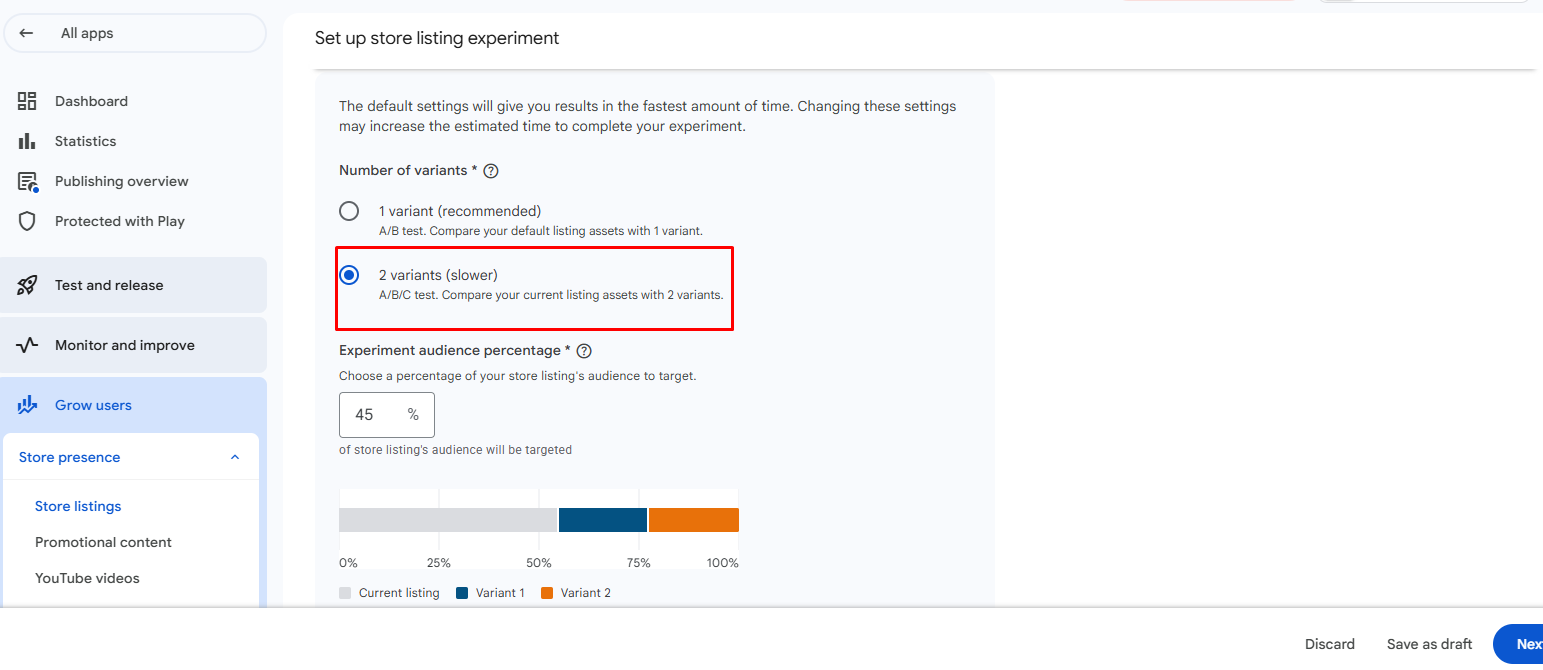
| Option | Test type | Speed |
|---|---|---|
| 1 variant (recommended) | A/B — your current listing vs one new version | Faster |
| 2 variants (slower) | A/B/C — your current listing vs two new versions | Slower, because traffic is split three ways |
Experiment audience percentage is the share of your store listing visitors who take part in the test. The traffic in the test is split equally between your variants, and everyone else sees your current listing. Try it:
Step 5: Minimum detectable effect and confidence level
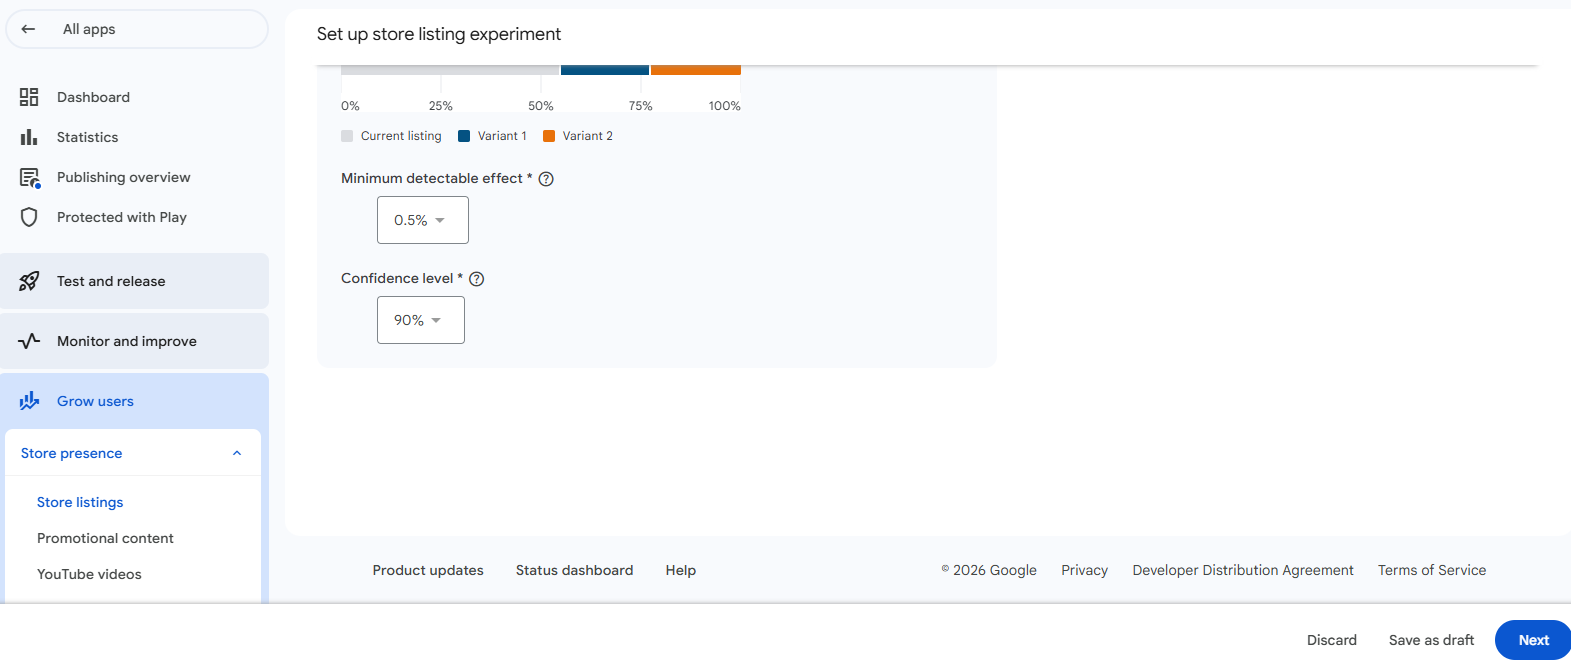
Minimum detectable effect (MDE)
The MDE is the smallest difference between a variant and your current listing that the experiment needs to see before it can declare a winner. Think of it as the size of the improvement you care about.
When you open the dropdown, Play Console shows how many unique-user install clicks the experiment will need for every option. Note that it counts install clicks, not visitors. Here are the exact numbers from our example app (90% confidence):
| MDE | Install clicks needed | vs 2.5% MDE |
|---|---|---|
| 0.5% | 1,176,769 | 25× more |
| 1.0% | 294,193 | 6.3× more |
| 1.5% | 130,753 | 2.8× more |
| 2.0% | 73,549 | 1.6× more |
| 2.5% | 47,071 | — |
| 3.0% | 32,689 | 31% fewer |
| 4.0% | 18,388 | 61% fewer |
| 5.0% | 11,768 | 75% fewer |
| 6.0% | 8,173 | 83% fewer |
Confidence level
The confidence level is how often the result range will contain the true performance. At 90%, you accept roughly a 1-in-10 chance of a false alarm. Higher confidence = more certainty, but more installs needed. Same example app, 2.5% MDE:
| Confidence level | Install clicks needed | vs 90% |
|---|---|---|
| 90% | 47,071 | — |
| 95% | 61,232 | +30% |
| 98% | 81,117 | +72% |
| 99% | 97,209 | +107% (about 2×) |
| Setting | Faster test | More reliable test |
|---|---|---|
| MDE | Larger (4–6%) | Smaller (1–2%) |
| Confidence level | 90% | 95–99% |
| Variants | 1 | 2 |
| Audience % | Higher | Lower |
Calculator: how long will my test take?
This calculator uses the same scaling as Google Play Console — it reproduces every number in the dropdowns above to within 0.01%. Enter the number Play Console shows for 2.5% MDE at 90% confidence for your app, plus your daily store listing installs, and it estimates the duration for every MDE and confidence combination.
Step 6: Choose the asset type
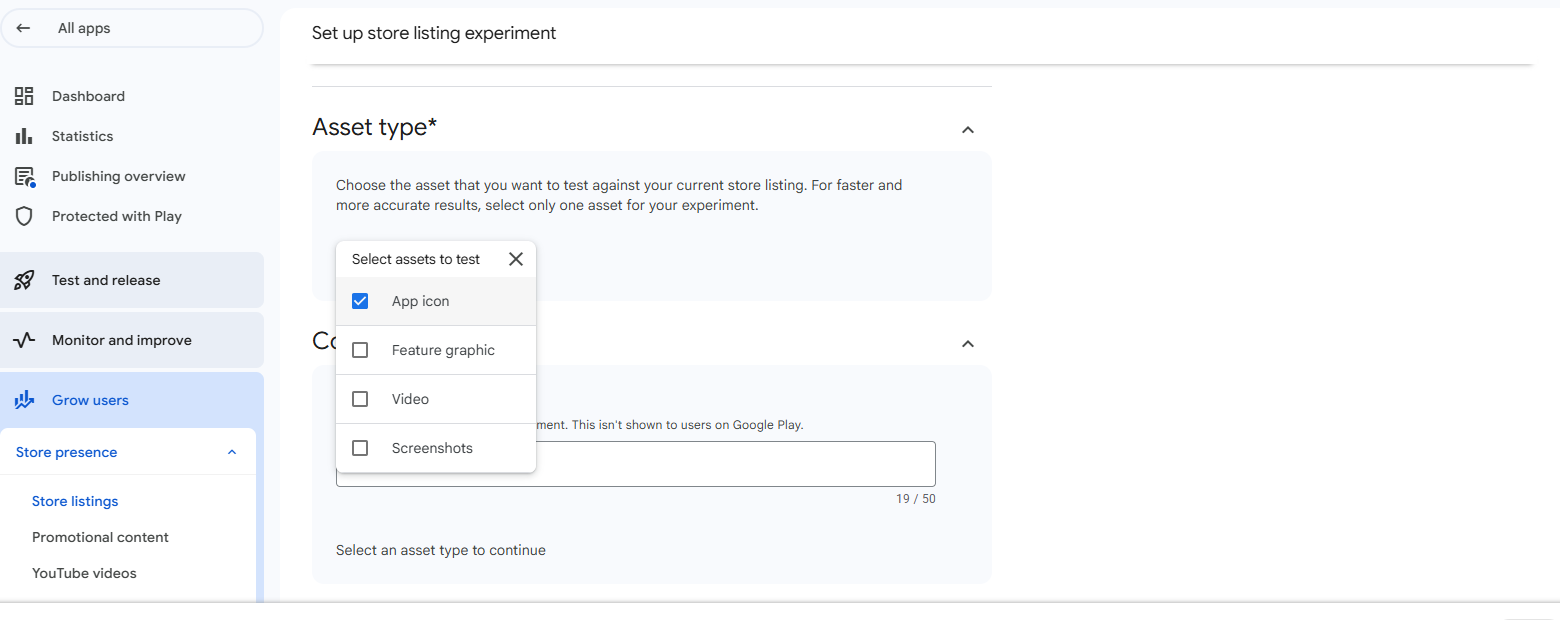
Click Next. Under Asset type, choose what you want to test: App icon, Feature graphic, Video or Screenshots. Google recommends selecting only one asset for faster and more accurate results.
Step 7: Name your variants
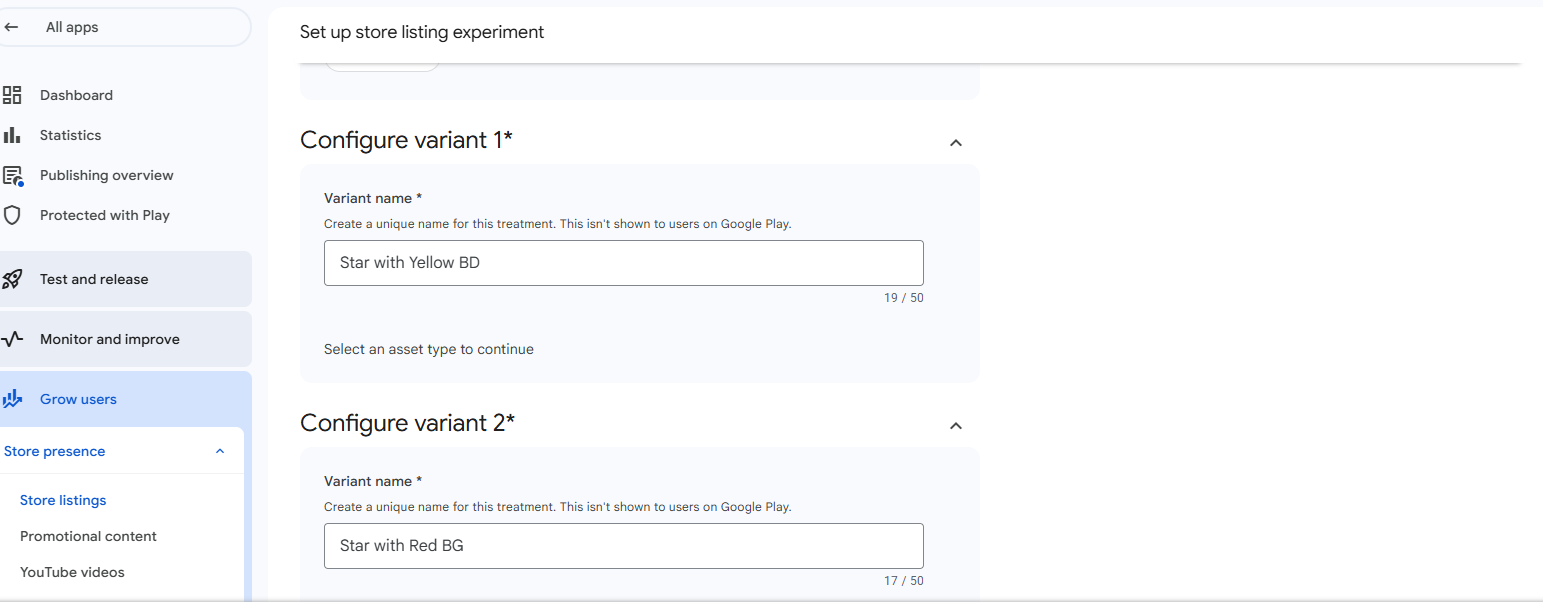
Now configure each variant. Give every variant a descriptive name (up to 50 characters, only visible to you) that says exactly what changed.
| Weak name | Strong name |
|---|---|
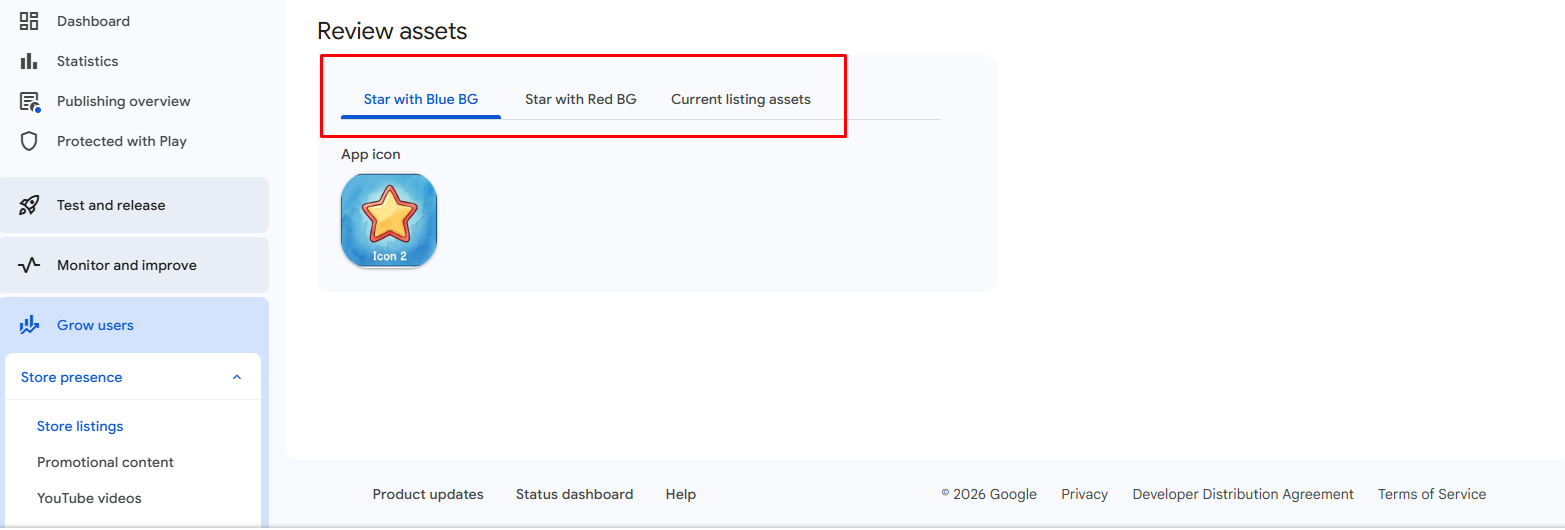
| Variant 1 | Star with Blue BG |
| New icon | Star with Red BG |
| Test B | Bigger character, no text |
Step 8: Upload your icon variants
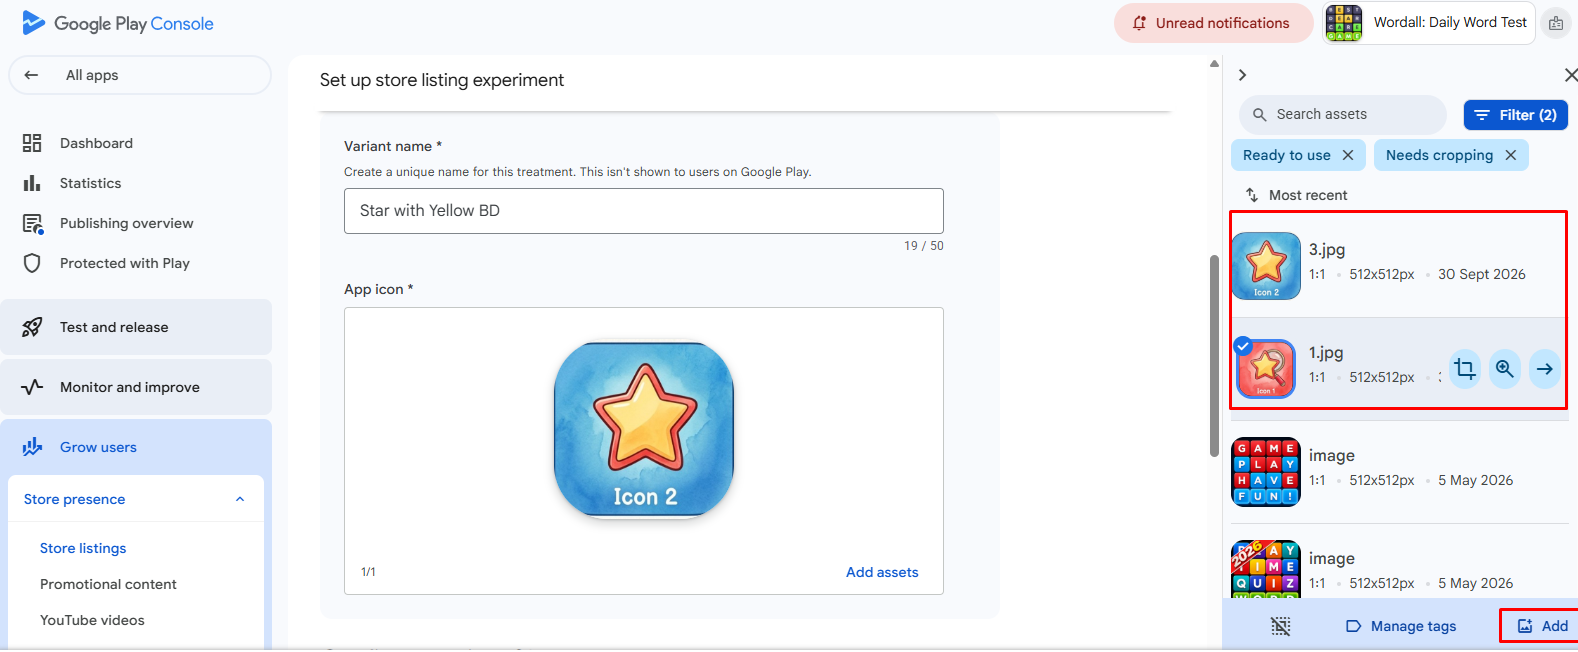
Under each variant, click Add assets in the App icon box. The asset library opens on the right:
- Upload new icons with Add (bottom right), or pick ones you uploaded before.
- Select the icon for this variant — a blue tick appears on it.
- Confirm with the → arrow. The icon now shows in the variant box.
- Repeat for Variant 2 with a different icon.
Step 9: Review details and AI asset declaration
The Review details screen shows your experiment name, type and target metric. Check them carefully — the name can’t be changed later.
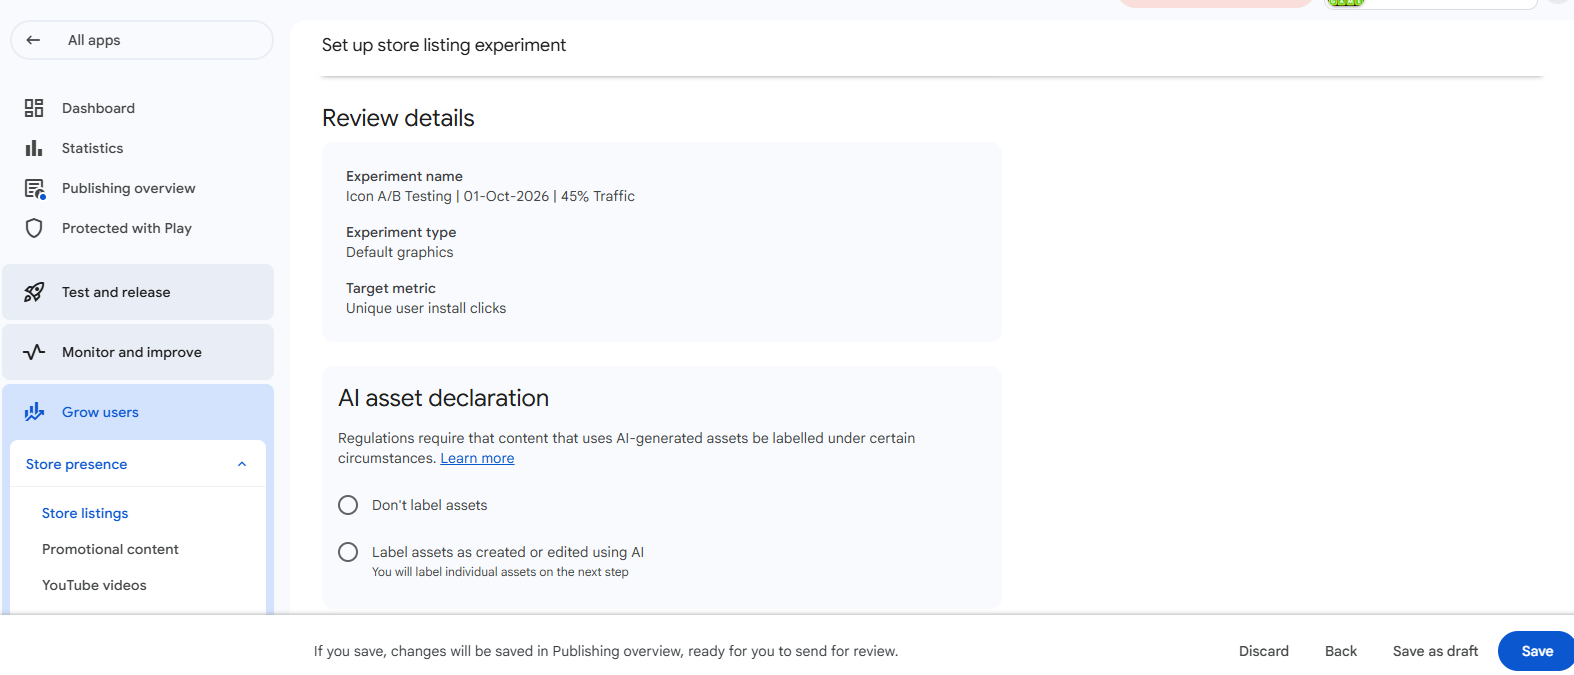
Below it is the AI asset declaration. Regulations require that content made with AI-generated assets is labelled in certain cases:
- Don’t label assets — your icons were designed without generative AI.
- Label assets as created or edited using AI — you’ll label each individual asset on the next step.
Click Save. Your experiment is saved to Publishing overview, ready to send for review.
Step 10: Review assets and send for review
Before you send it, open Review assets. There is one tab per variant plus Current listing assets. Click through each tab and make sure every variant shows the right icon.
- Go to Publishing overview in the left menu.
- Find your experiment under the changes ready to send.
- Click Send changes for review. Once Google approves them, the experiment starts automatically.
How to read the results
Once the experiment is running, open it from Store listings → Experiments → View results. For each variant, Google Play shows the installs (or opens) and a performance range: a confidence interval showing how much better or worse the variant is likely to perform than your current listing.
| Result | What it means | What to do |
|---|---|---|
| Apply variant (a winner is recommended) | The variant beat the current listing by at least the MDE | Apply it — then plan your next test |
| More data needed | Not enough visitors yet to decide | Keep it running, or restart with a bigger MDE / 1 variant |
| Draw | No meaningful difference between variants | Keep your current listing and test a bolder idea |
| Keep current listing | The control performed best | Keep your current assets — the test protected you from a worse icon |
Experiments stop automatically after 6 months. Run each test for at least 7 days so weekday and weekend traffic are both included — even if a result appears sooner.
Calculator: should I apply the variant?
Google Play’s performance range often looks like “−5% to +20%”. So is that a win? Google Play experiments can’t segment traffic, so high-intent users (for example people searching your brand name) can “smother” the real effect of a new icon. This calculator gives you a cautious, practical answer.
How it works: it takes a low percentile of the performance range as a conservative score. If that score is above zero, most of the range is positive and it’s reasonably safe to apply the variant. Your risk appetite decides how cautious it is: Low = 20th percentile, Moderate = 25th, High = 30th.
| Performance range | Risk appetite | Score | Decision |
|---|---|---|---|
| +10.2% to +30.5% | High | +16.29% | ✅ Apply |
| −4% to +18% | Moderate | +1.50% | ✅ Apply |
| −8% to +12% | Moderate | −3.00% | ❌ Don’t apply |
Pro tips for winning icon experiments
Best practices
- Test the high-impact assets first — icons, videos and screenshots.
- Test one asset at a time for the clearest results.
- Run every test for at least a week to cover weekday and weekend traffic.
- Revisit assets over time — users, markets and seasons change.
- Turn on email notifications so you know when a winner is declared.
- Make bold changes. A slightly different shade of blue rarely moves installs; a different color, character or composition can.
- Keep a test log — hypothesis, settings, result and learning for every experiment.
Common mistakes
- Changing the icon and screenshots in the same test.
- Completely redesigning the icon instead of improving the current one.
- Choosing a tiny MDE (like 0.5%) on a low-traffic app — the test never finishes.
- Stopping a test after 2–3 days because one variant “looks” better.
- Applying a variant whose range is mostly negative.
- Forgetting that the listing change affects every user — check retention after applying a winner, not just installs.
- Vague variant names like “Variant 1” that mean nothing a month later.
FAQ
Are Google Play store listing experiments free?
Yes. Store listing experiments are built into Google Play Console at no cost.
How many variants can I test?
Up to 2 variants against your current listing (an A/B/C test). One variant is faster and is Google’s recommendation.
How many experiments can run at the same time?
One default graphics experiment, or up to five localized experiments — one per language.
How long should an experiment run?
At least 7 days. Use the duration calculator above to estimate the time for your traffic. Experiments stop automatically after 6 months.
Can I A/B test my app title or description?
Yes, with a localized experiment you can test text as well as graphics, in up to five languages.
What MDE should a small app use?
A higher one — around 5–6% with 90% confidence. Smaller MDEs need far more installs; in our example, 0.5% needed over 1.1 million install clicks.
What size should my test icon be?
512 × 512 px, 32-bit PNG, up to 1 MB. Design it as a full square — Google Play applies the rounded shape.
Over to you 👇
💬 What will you test first — your icon or your screenshots? Tell me in the comments.
👥 Know a developer who has never run a Play Store experiment? Send them this guide.
♻️ Found it useful? Share it with your team.